Imagine all of your advisors plan data and tools, wrapped in efficiency driving workflows, customizable management reporting and customizable oversight and transparency for management and compliance. No imagination required – FDI’s Business Management Dashboard will change the way you do business.
.png)
Data: How and When You Need It
The Business Management Dashboard includes data aggregation from Recordkeepers. This data populates Snapshot which provides the home office with updates on the scale and growth of individual advisors, groups as well as the overall business. The details are available to download to Excel via the Analytics panels.
Efficiency and Scalability
To-Do’s are ad-hoc tasks that can be created on the desktop or on any mobile device. To-Do’s can be assigned by the home office to individual advisors, groups or all advisors. Report on To-Do’s for compliance oversight and management reporting.
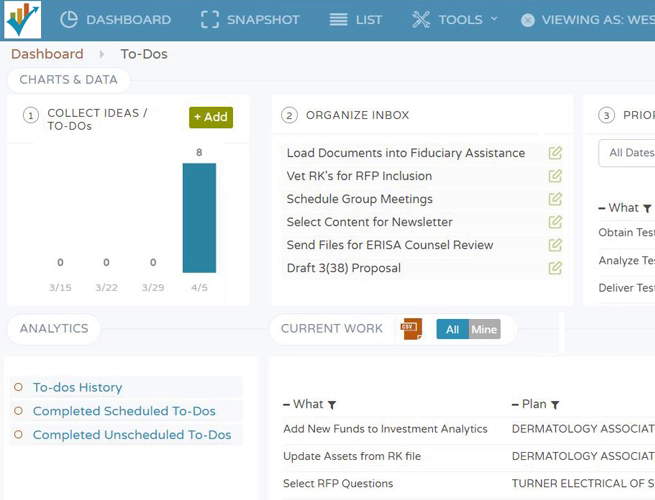
To-Do's Panel
This is the starting point for your advisors' new found efficiency. See To-Do counts on a weekly basis, add details to To-Do's or expand to see your full list and sort and filter to get your desired view.
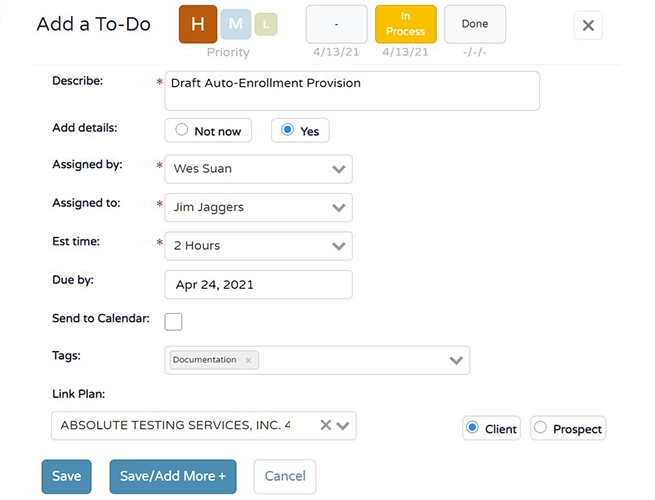
Add To-Do's
This is where your advisors can add task details that drive efficiency and value for future reporting. Add a priority, delivery date, assign it to someone, make notes and much more...
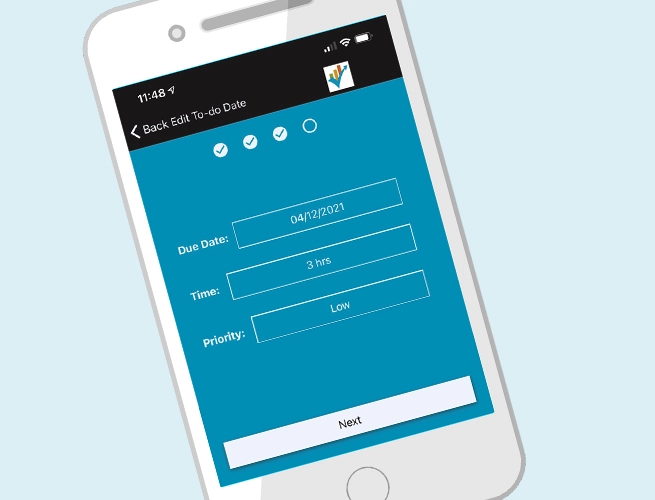
To-Do's Mobile
We believe your advisors should be able to work wherever they are. So, To-Do's are mobile enabled. They can update statuses, change due dates, make notes, change assignments and more all from their Apple or Android phone or tablet.
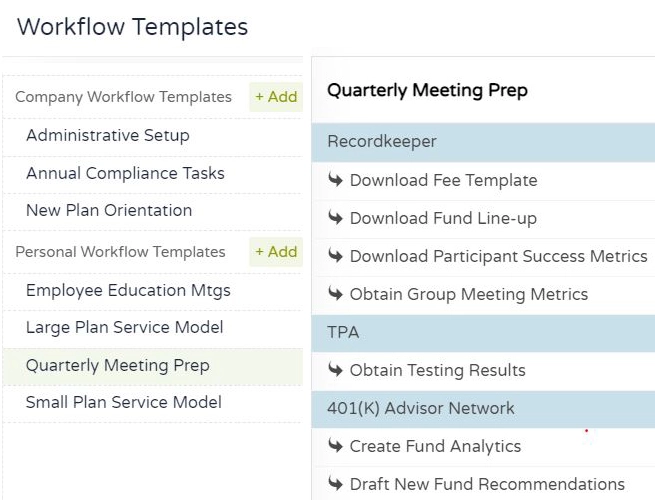
Workflows are groups of pre-set To-Do’s that can be utilized across both client and prospect plans. Assign to one or many plans and set a cadence that indicates that the next To-Do should be set forward “x” amount of time after completion of the prior To-Do.
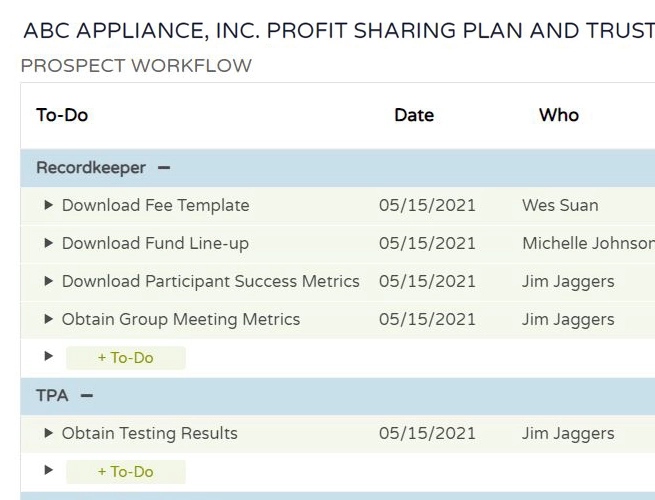
Book a DemoProspect Workflow Panel
If something is working why not repeat it? This is the purpose of our Workflow Panel. It allows your advisors to build a sequence of To-Do's, save them as a template and re-use them across many plans. This efficiency driving feature will allow your advisors to interact with more prospects making them more scalable as well as increasing their effectiveness.
Add Workflow
Your advisors can simply add a workflow by defining their sections, adding groups of To-Do's, clicking the save as a workflow button and then naming the workflow. The workflow is then available to add to other plans via the apply workflow template button.
Simplified Sales Management
.png)
.png)
See your advisors aggregate sales opportunity in the sales funnel. Build To-Do’s and workflows to move suspects to prospects to clients more effectively. Monitor and report on your aggregate sales opportunity. Sell more efficiently and effectively than ever before.
5500 Search
Looking to help your advisors to add more prospects to their pipeline? They can use FDI's 5500 Search to find targeted plans by plan size, geography, service provider, investment structure and more...
Learn MoreSales Funnel and Pipeline
The Sales Funnel is where your advisors can manage the details of their sales efforts. Set plans as suspects or prospects, see the median compensation for plans of similar size based on FDI's data or set a custom fee and click to see the details for any plan. The Pipeline is where they can see their aggregate compensation opportunity and closed business. The Home Office view allows you to see aggregate or filtered datasets.
Technology Working Together

FDI's Business Management Dashboard is an open architecture solution which means that almost any tool/service can be integrated.** The possibilities are endless. Want to share data with your CRM - integrate it. Want to quickly see and or access your Investment Analytics without an additional login - integrate it. Want to quickly learn the status of your RFPs - integrate it.
Integration is defined as single sign-on access to a third party tool/service as well as the potential for real-time data exchange.
**FDI will integrate with third party service providers using FDI's APIs where applicable and reasonable.
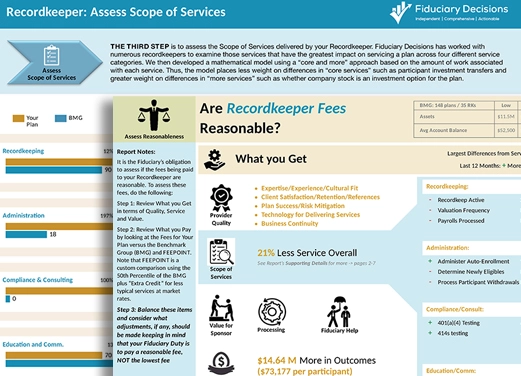
Value and Fee Benchmarking
FDI’s industry leading benchmarking is included and unlimited within the Business Management Dashboard. The enhanced user interface allows your advisors to quickly benchmark their practice, schedule reports and manage against best practices. This process ensures fee reasonableness and provides risk mitigation to the home office.
Broker Dealer Services
| Goals | |||
| Practice Management | Protect Plan Sponsors | Improve Participant Outcomes | |
|
Business Management Dashboard |
|||
|
Data Aggregation |
|||
|
To-Do's/Workflow |
|||
|
Value and Fee Benchmarking |
|||
|
FeeChecker |
|||
|
FeeBuilder |
|||
|
Sales Funnel/Pipeline/5500 Search |
|||
|
408(b)(2) Compliance |
|||
|
Document Vault |
|||
|
Open Architecture Integrations |
|||
|
Retirement Outcomes Evaluator |
|||
|
IRA Services |
|||
|
IRA Rollover- Best Interest Determination |
|||